Conviction Fund Semi-Annual Report
JUNE 30, 2026
The Fund takes concentrated positions in securities we believe are mispriced based on a proprietary thesis.
PERFORMANCE
The Conviction Fund had a net return of -1.2% in the first half of 2026. Inflation was 9.8% as measured by our custom cost of living index and 1.4% as measured by the Canadian Consumer Price Index.
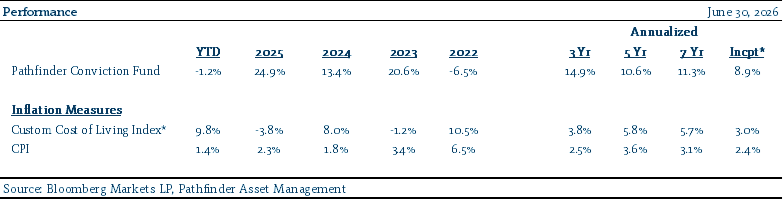
North American equity indices were again driven by outperforming subsectors: oil was the major driver in Canada, while names related to Artificial Intelligence drove indices in the US. We didn’t have exposure to either of these themes. Oil prices appreciated behind the emergence of a war in the Middle East, which we weren’t expecting. Regarding artificial intelligence, we have concerns that valuations within the space may be stretched.
Our two largest positions performed well, with shares of Knight Therapeutics Inc. (GUD:TSX) and Gamehost Inc. (GH:TSX) delivering year to date returns of 63% and 20% respectively. In the case of GH, the company was acquired by another casino operator at a modest premium, crystalizing a longtime holding of the fund.
We also had some positions trade lower. Shares of CGI Inc. (GIB.A:TSX), a global technology consultant, traded 28% lower on concerns AI will disrupt their business. We share those concerns but believe the market has overacted to the threat. BRP Inc. (DOO:TSX), a leader in powersports, was victim to a change in the US administration’s definition of derivative steel products for tariffs. For applicable products, DOO’s tariff rate changed from ~3% to ~25% which has a large negative impact on the company’s profitability. Shares of DOO had a total return of -10% in the first half of the year.
CONVICTION SPOTLIGHT
GAMEHOST INC.
We are continuing the conviction spotlight section of our semi-annual report, where we spotlight an investment, highlighting our thesis and how the investment has played out. In this edition, we spotlight Gamehost Inc., a longtime holding that was just acquired.
GH owns and operates casinos, hotels, and entertainment venues in Alberta. Specifically, they own and operate a casino and entertainment venue in Fort McMurray, a casino and hotel in Calgary, and a casino and two hotels in Grand Prairie. The company also owns the land and buildings associated with these businesses, except for Fort McMurray. Casinos in Canada are high quality businesses with low capital expenditures, regulated competition, and healthy free cash flow. GH was also unique in that insiders owned >40% of the company.
GH operates in regions that are sensitive to oil economics, so when oil prices crashed in 2015 GH experienced a sizeable contraction in profitability and its share price. After this contraction, we researched the company and met with management for potential investment. We ultimately invested in GH with the following thesis:
- We own GH for the underappreciated value of its assets; in particular, its regional gaming monopolies and real estate ownership.
- It is also a high-quality way to play an Alberta recovery that has added optionality from any oil recovery.
After investing, we monitor our thesis to manage how we can be wrong or right. Our thesis was playing out nicely from 2015 to 2020, but this changed during the COVID pandemic. During COVID, hospitality venues were forced to close for an extended duration which resulted in the demise of many companies in the industry. However, with low debt levels and minimal lease expense (due to real estate ownership), GH survived this period of closure. In fact, the company used this downtime to renovate and expand its venues, and we used it as an opportunity to add to our investment at bargain prices. Ultimately, GH survived this period and came out stronger.
Following COVID, GH’s expanded venues benefitted from an economic renaissance in Alberta, with the province incurring the strongest population growth in the country. Unlike past Alberta cycles, this renaissance wasn’t driven by oil prices but by affordability, spare infrastructure, and the emergence of alternative sectors like technology. By 2023, GH delivered free cash flow per share ~50% higher than pre-pandemic levels. This drove a strong recovery in the share price.
In March this year, GH announced that it was being acquired by Pure Casino Entertainment LP for $13.65/share. This was a modest premium to its share price at the time but a meaningful premium to our average cost of investment. Including dividends, we earned a 12.5% IRR over our >10 year holding period, a reasonable annualized return. We hope to find similar opportunities in the future.
INVESTMENT OUTLOOK
DIVERGENCE WITHIN THE STOCK MARKET
The broad stock market frequently projects an image of uniform stability. The market seems to operate under the assumption that a rising economic tide is lifting all boats. In this narrative, the market is a cohesive machine where all stocks move up and down in unison.
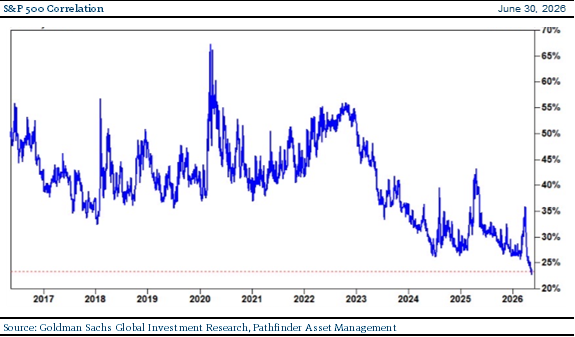
However, the internal reality of today’s environment sharply contradicts this surface-level harmony, as evidenced by implied correlation indexes plunging toward historic lows (see graph below). Beneath the calm index surface, individual equities are moving almost entirely independently of one another, a phenomenon driven by high dispersion and highly concentrated single-stock volatility. Rather than moving in tandem as they traditionally do, different sectors and individual companies are decoupling. As seen in the graph below, this has been the emerging environment over the last 3.5 years.
Our recent investment outlooks have focused on the divergence occurring within individual stocks. We believe it is being driven by major fundamental changes in operating environments and passive investing. With major changes in operating environments, it’s more important than ever to be doing insightful fundamental research. At the same time, we now have the highest amount of capital being allocated without regard to fundamental research (passive investing). This creates individual security mispricing that can correct independent of the broad market direction. So, as we’ve been highlighting to clients, we aren’t that optimistic of the overall market, but we are optimistic of the current environment as it provides opportunity to find individual mispricing’s.
FINAL REMARKS
Clients frequently ask, “how is the market doing?” as a shorthand for asking “how are my investments doing”, but this broad question has become largely irrelevant due to the extreme market dispersion we have been highlighting. Because different sectors, industries, and individual stocks are performing so vastly differently from one another, a falling market does not necessarily mean individual portfolio reduction, and a rising market does not guarantee individual portfolio growth.
It’s a market of individual stocks today, not the stock market.
“This widening gap between the market’s winners and losers is called dispersion, in which one group of stocks rises while another falls, allowing the broader index to appear more stable than it really is” – MarketWatch
National Instrument 31-103 requires registered firms to disclose information that a reasonable investor would expect to know, including any material conflicts with the firm or its representatives. Doug Johnson and/or Pathfinder Asset Management Limited are an insider of companies periodically mentioned in this report. Please visit www.paml.ca for full disclosures.
Changes in Leverage. We are increasing the asset ceiling to 2.0 times the market value of equity for Pathfinder International Fund and Pathfinder Conviction Fund to be consistent with Pathfinder Partners’ Fund and Pathfinder Resource Fund.
*All returns are time weighted and net of fees. Performance returns from the Real Fund are presented based on the Class C Master series. Inception and 2013 returns include the 10 months from inception in March 2013. Returns greater than one year are annualized. The custom cost of living and CPI provide general information and should not be interpreted as a benchmark for your own portfolio return. The custom cost of living represents an equally weighted (at inception) basket of Teranet-National Bank National Composite House Price Index™, UBS E-TRACS CMCI Food Total Return ETN ETF (FUD:NYSE), United States Gasoline ETF (UGA:NYSE) and Canadian import prices from Statistics Canada in Canadian dollars. We created the custom cost of living index to give investors another way to measure their cost of living. It has some differences versus CPI; for example, CPI measures shelter costs as the cost of renting a home versus the custom index which measures it as at the cost of purchasing a home. A bachelor may view renting as an accurate gauge of shelter costs. On the other hand, a mother and father who want to raise their family under the security of the same roof without the risk of forced relocation likely views home ownership as a more accurate gauge of shelter costs.
Pathfinder Asset Management Limited (PAML) and its affiliates may collectively beneficially own in excess of 10% of one or more classes of the issued and outstanding equity securities mentioned in this newsletter. This publication is intended only to convey information. It is not to be construed as an investment guide or as an offer or solicitation of an offer to buy or sell any of the securities mentioned in it. The author has taken all usual and reasonable precautions to determine that the information contained in this publication has been obtained from sources believed to be reliable and that the procedures used to summarize and analyze such information are based on approved practices and principles in the investment industry. However, the market forces underlying investment value are subject to sudden and dramatic changes and data availability varies from one moment to the next. Consequently, neither the author nor PAML can make any warranty as to the accuracy or completeness of information, analysis or views contained in this publication or their usefulness or suitability in any particular circumstance. You should not undertake any investment or portfolio assessment or other transaction on the basis of this publication, but should first consult your portfolio manager, who can assess all relevant particulars of any proposed investment or transaction. PAML and the author accept no liability of any kind whatsoever or any damages or losses incurred by you as a result of reliance upon or use of this publication.