Pathfinder Small Cap Quarterly Report
MARCH 31, 2026
The Pathfinder Small Cap mandates invest in high-torque, early-stage companies that have the potential to generate superior returns.
Pathfinder Partners’ Fund
The Partners’ Fund had a net return of +2.4% in the first quarter of 2026. This compares to the TSX Venture Exchange which had a return of -3.0% in the first quarter. Our annualized 10-year return is +17.3% compared to the TSX Venture Exchange’s return of +5.1% over the same period. The table below provides the performance summary.
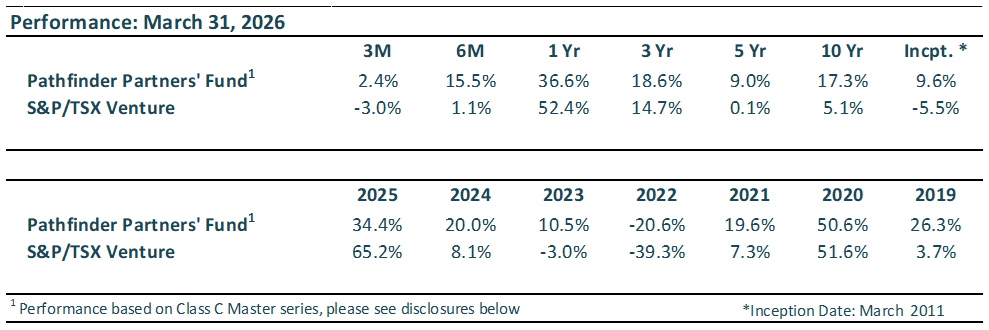
Our top contributors for the quarter was NameSilo Technologies Corp. (CSE:URL) and our main detractor was Libertystream Infrastructure Inc. (TSXv:LIB).
In our FY 2025 Quarterly Report, we noted that while momentum in the market often persists, we expected the pace of gains to moderate in 2026. The first quarter of 2026 validated our caution, with the broad majority of indices, excluding commodities, averaging a decline.
Market dynamics are always multifaceted, yet the primary catalyst for the recent decline in the technology sector was Anthropic’s release of its AI agent “Claude Cowork”. This autonomous coding system threatened to disrupt the entire Software as a Service sector in an event now dubbed the “SAASpocalypse”. This volatility was further compounded in late February as the U.S. entered a conflict with Iran, heightening global fears regarding energy prices, inflation, and dampened GDP growth. Meanwhile, a quieter but significant risk is emerging in private credit. We have seen private equity firms expanding lending beyond institutional investors to retail, resulting in an expansion of lending from $300 billion 10 years ago to $1.8 trillion today. Private credit has had many years of strong performance and low delinquencies, leaving the industry perhaps unprepared for rising defaults.
In anticipation of periods of weaker returns, we entered the year with a reinforced balance sheet. We continued to build our cash reserves through Q1, harvesting wins in our biotech and commodity positions (assets less correlated with the broader market) to build a cash “war-chest” for deployment during volatile periods. Our foresight has allowed us to take advantage of the software downturn to add to our positions in high-quality businesses that we previously flagged as attractive but overpriced on aspirational future expected returns. In our view, the SaaS business model is at risk from sophisticated AI-assisted coding, but SaaS business models that rely on proprietary first-party data, operate in highly regulated industries (such as healthcare and government), and remain deeply embedded in day-to-day operations will see little disruption. In fact, we believe these businesses may ultimately experience operational enhancement from AI coding tools.
A recent addition to the portfolio we are excited about is RenovoRx Inc. (RNXT), a medical device company pioneering a novel delivery technique for locally advanced pancreatic cancer (“LAPC”). LAPC is typically a Stage III or IV unresectable cancer (surgery isn’t an option) with an abysmal two-year survival rate of less than 10%. The scarcity of effective treatments is highlighted by the recent FDA-approved therapy from NovoCure (NVCR), the first approved therapy for LAPC in 30 years, which demonstrated a two-month survival benefit over the standard of care. While two months may seem de minimis, that milestone added ~$1.3B in value to NovoCure’s market capitalization. By comparison, RenovoRx’s device is showing an improvement of over five months compared to standard of care and requires 50% less chemo-exposure, greatly improving patient quality of life. We anticipate full Phase 3 enrollment later this year with results in the first half of 2027. If positive, the results could re-rate RenovoRx from its current $45M market capitalization to a valuation closer to $1B.
Regular readers will know that we are fundamentally driven investors. While macro developments may color how we view sector favourability, we ultimately select businesses based on their fundamental merits. That said, we would be remiss to not address the broader implications of the U.S. – Iran conflict. Energy supply disruptions of this scale for this length of time will likely be inflationary and result in more expensive cost of capital for businesses. In practice, this forces companies to divert capital away from growth initiatives and into daily operations, resulting in lower valuations.
We remain mindful that near-term growth expectations will likely be lower than they were prior to the conflict, but we are confident in our ability to identify opportunities in resilient businesses that the market has unfairly discounted, while remaining disciplined in mitigating downside risk.
Pathfinder Resource Fund
The Resource Fund had a net return of +21.1% in the first quarter of 2026. This compares to the benchmark which had a net return of +18.7% for the first quarter. Since inception (July 16, 2018), the Resource Fund has returned +22.2% annualized versus the benchmark’s return of +16.0%. The table below provides the performance summary.
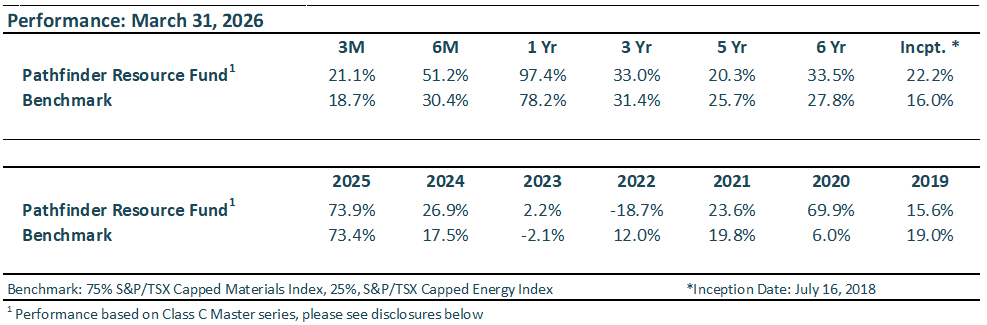
Our top contributors for the quarter were XEG & XLE (Canadian and US listed Energy ETFs), Brent Crude Futures, Blue Moon Metals (TSXv:MOON), and Aurion Resources (TSXv:AU). Our main detractors were Libertystream Infrastructure Inc. (TSXv:LIB), and Ivanhoe Mines Ltd. (TSX:IVN).
We had a strong start to the year amidst a volatile commodity market and the escalation of conflict in the Middle East. Despite the euphoric sentiment from general investors in the commodities market, we were leery that the market may be overextending itself. We decided to take profits across the portfolio early in the quarter and reposition the fund towards oil and gas (O&G), while maintaining a substantial cash position in case of a major pullback in the mining sector. Our bullish outlook paid off as we were able to capitalize on stronger oil and gas prices translating to direct gains from ETFs and crude oil futures.
Following a strong performance in 2025, our priority has shifted toward capital preservation and disciplined risk management. In this context, we have increased our cash allocation to provide downside protection and maintain flexibility in the event of a broader market correction. We have considered risks in market related to tariff turmoil, geopolitical issues, and private credit risk as factors that may lead to a buying opportunity if the overall market has a pull back. As our readers know, ongoing tariffs have led to increased consumer costs but also higher input costs for commodity producers. These factors could introduce volatility and, in turn, create more attractive entry points.
An overlooked consequence from the disruption at the Strait of Hormuz has been the production of sulphur. While sulphur prices had increased in October, we saw another significant rise in price due to the recent conflict. Prices have surged to over $650/tonne, an increase of 165% year over year. The conflict has compounded an already “tight market.” Shipping through the Strait accounts for over 50% of global seaborne sulfur trade or ~25% of global sulfur supply which has effects on copper, nickel, and uranium globally.
In terms of copper, sulfuric acid is critical to the hydrometallurgical processes of leaching and solvent extraction/electrowinning (SX/EW) that produces cathode copper and can replace traditional smelting for certain deposits. This method accounts for 16-20% of global refined copper production. The current sulphur shock is having an immediate and potential medium-term effect on copper supply and copper prices. Approximately 90% of the sulphuric acid used in the DRC is imported from the Middle East; however, operations such as Ivanhoe Mines Ltd. (TSV.IVN) produce sulphuric acid as a byproduct from their smelter and will benefit from the increase in price decreasing their overall processing costs which are already some of the lowest in the industry. The smelter is currently at about 60% capacity but at 100% capacity they will produce 600,000-700,000 kt tonnes to help supply the DRC market that requires 2 Mtpa. This is a strategic advantage versus other copper producers who rely on refining their copper concentrate through the use of sulphuric acid an input cost vs a by product credit for IVN.
Similarly, for nickel, specifically marginal supply from laterite ores which require high pressure acid leach (HPAL), sulphuric acid is a main input. Due to the recent higher prices, three of the largest Indonesian HPAL nickel processers have trimmed production by 10% already. Sulphuric acid in these types of operations can account for 20-40% of operating costs. This margin compression is bullish for higher nickel prices. Over the last number of years, Indonesia has aggressively expanded nickel production introducing new marginal supply at lower costs than expected, depressing the overall market. As sulphuric acid costs rise, we expect operating costs to increase resulting in a curtailment of marginal low-cost Indonesian nickel supply and an increase in the nickel price due to supply balance.
The constraint on sulphuric acid also affects elements such as uranium. Higher sulphuric acid prices will curtail production resulting in a tighter supply and higher uranium prices. Kazatomprom NAC (LSE.KAP) is mainly an in-situ leach uranium producer meaning they require sulphuric acid injected into the ground to liberate the uranium. In-situ leach accounts for over ~50% of global uranium production while almost all of KAP’s production comes from this method indicating a potential short-term tightness in the market if producers are unable to access sufficient amounts of sulphuric acid.
There are many moving parts going forward with a potential credit risk cycle looming, input cost rising for mining producers, ongoing tariffs, and the Iran-US conflict; however, despite these uncertainties, we have derisked the portfolio to protect your returns. Our goal is capital preservation, and we will continue to focus on that while looking at new sectors to deliver torque to your portfolio.
National Instrument 31-103 requires registered firms to disclose information that a reasonable investor would expect to know, including any material conflicts with the firm or its representatives. Doug Johnson and/or Pathfinder Asset Management Limited are an insider of companies periodically mentioned in this report. Please visit www.paml.ca for full disclosures.
Changes in Leverage. We are increasing the asset ceiling to 2.0 times the market value of equity for Pathfinder International Fund and Pathfinder Conviction Fund to be consistent with Pathfinder Partners’ Fund and Pathfinder Resource Fund.
For more information, please follow the links above to review the fund term sheets.
* All returns are time weighted and net of investment management fees. Returns from the Pathfinder Partners’ Fund are presented based on the Class C Master series except prior to its inception in July 2011 when the Class A Master series was used. Inception returns include the 10 months from inception in March 2011. Returns greater than one year are annualized. Returns from the Pathfinder Resource Fund are presented based on the Class C Master series since its inception in July 16, 2018. The S&P/TSX Venture Composite Index (C$), the S&P/TSX Venture Composite Index, the S&P/TSX Capped Materials Index and the S&P/TSX Capped Energy Index provide general information and should not be interpreted as a benchmark for your own portfolio return. Further details of the Partners’ Fund are available on request.
Pathfinder Asset Management Limited (PAML) and its affiliates may collectively beneficially own in excess of 10% of one or more classes of the issued and outstanding equity securities mentioned in this newsletter. This publication is intended only to convey information. It is not to be construed as an investment guide or as an offer or solicitation of an offer to buy or sell any of the securities mentioned in it. The author has taken all usual and reasonable precautions to determine that the information contained in this publication has been obtained from sources believed to be reliable and that the procedures used to summarize and analyze such information are based on approved practices and principles in the investment industry. However, the market forces underlying investment value are subject to sudden and dramatic changes and data availability varies from one moment to the next. Consequently, neither the author nor PAML can make any warranty as to the accuracy or completeness of information, analysis or views contained in this publication or their usefulness or suitability in any particular circumstance. You should not undertake any investment or portfolio assessment or other transaction on the basis of this publication, but should first consult your portfolio manager, who can assess all relevant particulars of any proposed investment or transaction. PAML and the author accept no liability of any kind whatsoever or any damages or losses incurred by you as a result of reliance upon or use of this publication.