Pathfinder Small Cap Quarterly Report
JUNE 30, 2026
The Pathfinder Small Cap mandates invest in high-torque, early-stage companies that have the potential to generate superior returns.
Pathfinder Partners’ Fund
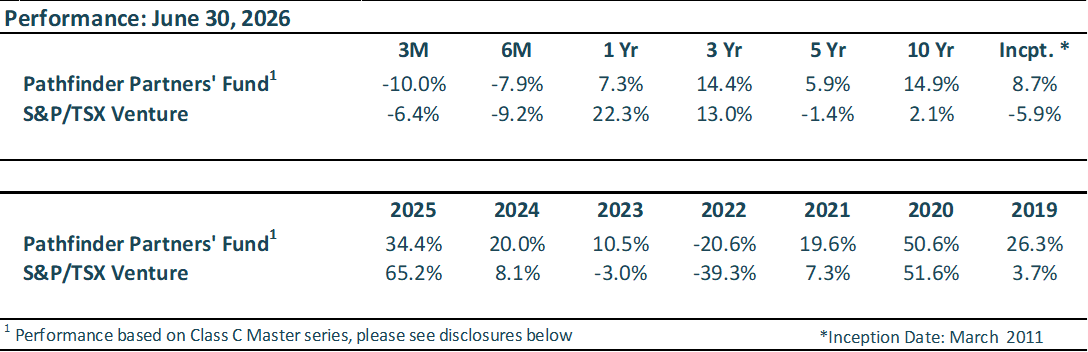
The Partners’ Fund had a net return of -10.0% in the second quarter of 2026. This compares to the TSX Venture Exchange which had a return of -6.4% in the second quarter. Our annualized 10-year return is +14.9% compared to the TSX Venture Exchange’s return of +2.1% over the same period. The table below provides the performance summary.
Our top contributor for the quarter was Delcath Systems Inc (DCTH) and our main detractors were Brent Crude Oil Futures and Namesilo Technologies Corp (CSE:URL).
Consistent with our Q1 Small Cap commentary, we remain focused on fortifying our balance sheet by actively taking profits on our top outperformers and trimming overweight holdings to mitigate single stock concentration risk across the portfolio.
The broader macroeconomic environment remains volatile, driven by sector specific dynamics and escalating geopolitical tensions. The AI and semiconductor appetite for infrastructure buildout continues to dominate the capital markets narrative, with AI data center-related spend projected to contribute over half of GDP growth for Q2 2026 – the same time last year, it accounted for roughly one-third of GDP growth. This hyper-concentration of economic activity has pushed valuations to historically lofty levels, risking significant market adjustments across AI-related sectors if realized earnings fail to match investors aggressive growth expectations. While timing is exceptionally hard to predict, we believe these elevated, speculative valuations will eventually consolidate as capital naturally rotates back into underperforming, fundamentally sound sectors.
During Q2, we executed on the strategy outlined in our previous commentary, systematically increasing our exposure to technology companies defined by strong operational moats and high switching costs. We focused specifically on businesses whose competitive advantages are secured by proprietary, first-party data or highly regulated, industry-specific expertise. Alongside these allocations, we selectively expanded our biotechnology exposure by participating in financings whose capital injection provides target companies with the necessary financial runway to reach pivotal readouts in their upcoming clinical trials. Finally, we’ve seen several of our private portfolio holdings transition to the public markets during the first half of the year; these newly public positions are performing well and we hope will become talking points in future quarterly reports.
To address the geopolitical volatility and potential disruptions in the Strait of Hormuz, we established tactical long positions in crude oil futures. We got this wrong, and the signing of a Memorandum of Understanding (MOU) rapidly compressed crude prices from the near-$100 range down into the $70s, hurting our Q2 performance. However, that MOU has since been abandoned, and oil prices have rebounded slightly to the low $80s. Looking forward, we believe global supply-side risks are actually more pronounced today than they were at the onset of the Iran-US war, and the safety net of global crude supply is wearing thin as Strategic Petroleum Reserves (SPR) continue to decline. The broadening instability in neighboring areas like Yemen and Saudi Arabia increase the risk of a severe supply shock; consequently, we believe a return to $100 crude remains a possibility, and we maintain our hedge against these energy price risks.
This year, we initiated a position in BeWhere Holdings Inc (TSXV: BEW), an IoT (Internet of Things) solutions provider that manufactures asset trackers and the software behind them. Their trackers are used by businesses to locate equipment, inventory, and goods in transit. They have several competitive advantages including being the lowest-cost provider with low power devices which allows their batteries to last for up to 10 years. This has won them Fortune 500 customers including Costco, Ford, UPS, Walmart, and Home Depot. Once the trackers and software are wired into a customer’s operations, they’re hard to switch away from. Every device carries a monthly subscription, and with their ‘land and expand’ business model, we see visibility for recurring revenue to grow double-digits over the coming years. BeWhere is now using its strong balance sheet to lease devices rather than sell them, a transition that we think will create more stability and higher lifetime value in their revenue stream.
While the Canadian venture market has broadly underperformed the US in the first half of the year due to massive AI driven momentum, we remain disciplined against chasing late-cycle “fear-of-missing-out” valuations that often signal market peaks. We are mindful of how geopolitical and macroeconomic pressures shape sector performance, and we remain confident in our disciplined approach to identifying resilient, unfairly discounted businesses that can withstand these broader systemic pressures.
Pathfinder Resource Fund
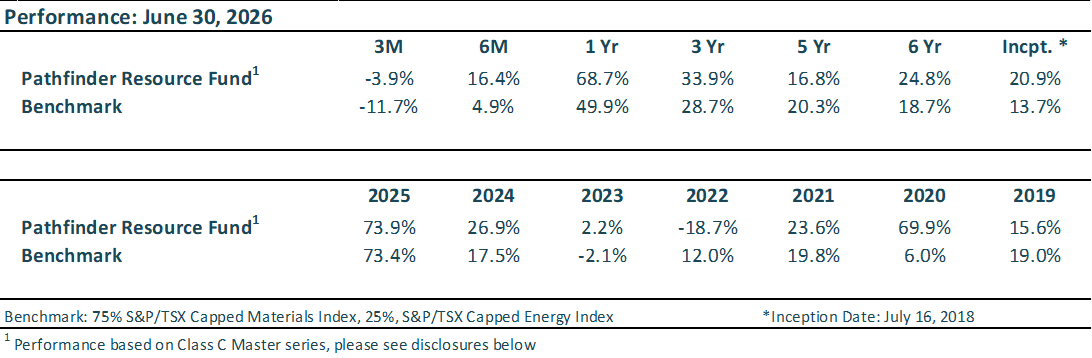
The Resource Fund had a net return of -3.9% in the second quarter of 2026. This compares to the benchmark which had a net return of -11.7% for the second quarter. Since inception (July 16, 2018), the Resource Fund has returned +20.9% annualized versus the benchmark’s return of +13.7%. The table below provides the performance summary.
Our top contributors for the quarter were Lumina Metals Corp. (TSX:LMCU), Fox River Resources (CSE:FOX), and Aurion Resources (TSXv:AU). Our main detractors were related to our Oil & Gas positions.
For the past several quarters, our strategy has been to take profits, with the overall goal of preserving capital for our clients. This tested our patience as markets continued to grind higher; however, the volatility in the second quarter has somewhat validated our strategy, notably in the precious metals space. The GDXJ (Gold Miners) fell 18% during the quarter and is down over 40% from its high at the time of writing and Silver has fallen by over 50% from its high earlier in the year as of writing. We have a high cash balance and are well positioned to be patient and deploy capital as opportunities arise.
As we have mentioned before, the mining sector moves in cycles. The typical cycle is characterized by, in strong markets, “a rising tide lifts all boats,” while in weak markets, investors tend to capitulate and over-correct, potentially missing great opportunities. Through both situations, our focus remains on quality. While we wait for the market to finish correcting, our current strategy involves selling put options on our favourite names at our target ‘buy price’. This allows us to generate income with our excess cash balance, and if these stocks decline below the strike price of the option, we then own the company at our target price.
At the start of the quarter, we saw some key M&A acquisitions occur most notably Aurion Resources and Fox River. Both are key holdings for us. We had discussed Fox River’s strategic phosphate nature and why it would be a potential acquisition target. More recently though, we had discussed in our FY 2025 Quarterly Report that Aurion Resources Ltd. (TSXv:AU) was a potential acquisition target. We outlined the operational synergies with Rupert Resources Ikkari gold deposit, noting that if Rupert were to mine the entire deposit using a low-cost open-pit method, part of the pit would likely extend onto Aurion’s ground, necessitating an acquisition. In April, Agnico Eagle Mines announced the acquisition of both Rupert and Aurion in a C$3.4 billion consolidation of Finland’s Central Lapland Greenstone Belt, with Aurion shareholders receiving approximately C$481 million in an all-cash transaction. On the back of that, Fox River Resources Corp. (CNSX:FOX) and their Martison Phosphate Project, a high-grade phosphate deposit in Ontario, was acquired in an all-cash deal valued at approximately C$94.3 million.
Both outcomes are examples of our investment process at work, trying to identify value ahead of the broader market. However, the process is long and arduous, which is why we work to mitigate risk wherever possible and focus on quality names that can weather sharp market swings.
Along those lines, critical metals have been en vogue and have recently dominated headlines. Previously, we noted that critical and energy transition metals have become tactical assets, increasingly used as geopolitical tools, and that countries were urgently seeking to diversify their supply chains away from China. This dynamic has accelerated faster than we anticipated.
As a result, we would like to highlight Blue Moon Metals (TSXv:MOON), a core holding in the Fund based initially on its permitted and ready to build copper assets in Norway. However, the company’s recent acquisitions, have transformed MOON into a strategically important company in the United States. In February, Blue Moon closed on the acquisition of the Springer tungsten mine and processing plant in Nevada, one of the only permitted tungsten mills in the United States. The company followed that with the acquisition of the Apex mine in Utah. Apex is historically the only mine in North America operated primarily for germanium and gallium. China has banned both metals from export to the U.S. since late 2024. These metals are essential inputs for semiconductors, fibre optics, and infrared systems used in defense applications. In our view, Blue Moon has been catapulted from a quality copper developer to one of the few publicly traded companies of strategic importance to the United States critical mineral supply chain.
The second quarter validated our cautious approach. As mentioned, our goal has been to “take” profits and preserve capital, allowing us to remain patient and deploy funds as opportunities arise. We continue to maintain a healthy cash position and will look to deploy capital in the near term across sectors we view as undervalued or strategically important.
National Instrument 31-103 requires registered firms to disclose information that a reasonable investor would expect to know, including any material conflicts with the firm or its representatives. Doug Johnson and/or Pathfinder Asset Management Limited are an insider of companies periodically mentioned in this report. Please visit www.paml.ca for full disclosures.
* All returns are time weighted and net of investment management fees. Returns from the Pathfinder Partners’ Fund are presented based on the Class C Master series except prior to its inception in July 2011 when the Class A Master series was used. Inception returns include the 10 months from inception in March 2011. Returns greater than one year are annualized. Returns from the Pathfinder Resource Fund are presented based on the Class C Master series since its inception in July 16, 2018. The S&P/TSX Venture Composite Index (C$), the S&P/TSX Venture Composite Index, the S&P/TSX Capped Materials Index and the S&P/TSX Capped Energy Index provide general information and should not be interpreted as a benchmark for your own portfolio return. Further details of the Partners’ Fund are available on request.
Changes in Leverage. We are increasing the liabilities ceiling to 2.0 times the market value of equity for Pathfinder International Fund and Pathfinder Conviction Fund to be consistent with Pathfinder Partners’ Fund and Pathfinder Resource Fund.
Pathfinder Asset Management Limited (PAML) and its affiliates may collectively beneficially own in excess of 10% of one or more classes of the issued and outstanding equity securities mentioned in this newsletter. This publication is intended only to convey information. It is not to be construed as an investment guide or as an offer or solicitation of an offer to buy or sell any of the securities mentioned in it. The author has taken all usual and reasonable precautions to determine that the information contained in this publication has been obtained from sources believed to be reliable and that the procedures used to summarize and analyze such information are based on approved practices and principles in the investment industry. However, the market forces underlying investment value are subject to sudden and dramatic changes and data availability varies from one moment to the next. Consequently, neither the author nor PAML can make any warranty as to the accuracy or completeness of information, analysis or views contained in this publication or their usefulness or suitability in any particular circumstance. You should not undertake any investment or portfolio assessment or other transaction on the basis of this publication, but should first consult your portfolio manager, who can assess all relevant particulars of any proposed investment or transaction. PAML and the author accept no liability of any kind whatsoever or any damages or losses incurred by you as a result of reliance upon or use of this publication.